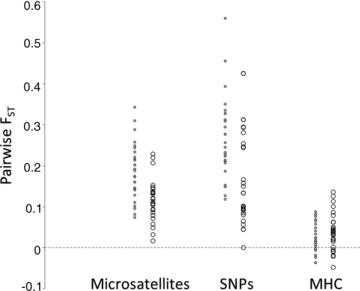
Figure 3.

Plot over pairwise FST across populations for microsatellites, SNPs, and MHC. Each value is a data point for pairwise FST between two populations. All pairs are represented by open circles. Small circles are pairwise FST were at least one of the two populations is a small isolated population. The larger circles in a lane on the right side of the small circles are all other population pairs, including both isolated and continuous population pairs. The negative FST values (below the dotted line) should be interpreted as no differentiation between pairs.
