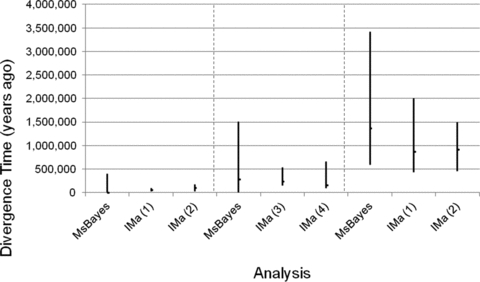
Figure 4.

Comparison of divergence time estimates from HABC (MsBayes) and Full-Bayesian (IMa) analyses: MsBayes mode and 95 percentile and IMa peak posterior and 95% Credibility intervals for each co-divergence event. Note that Tau 2, IMa (1), and IMa (2) are not shown as they had negative support for Ψ = 1 and Ω not close to 0, respectively.
