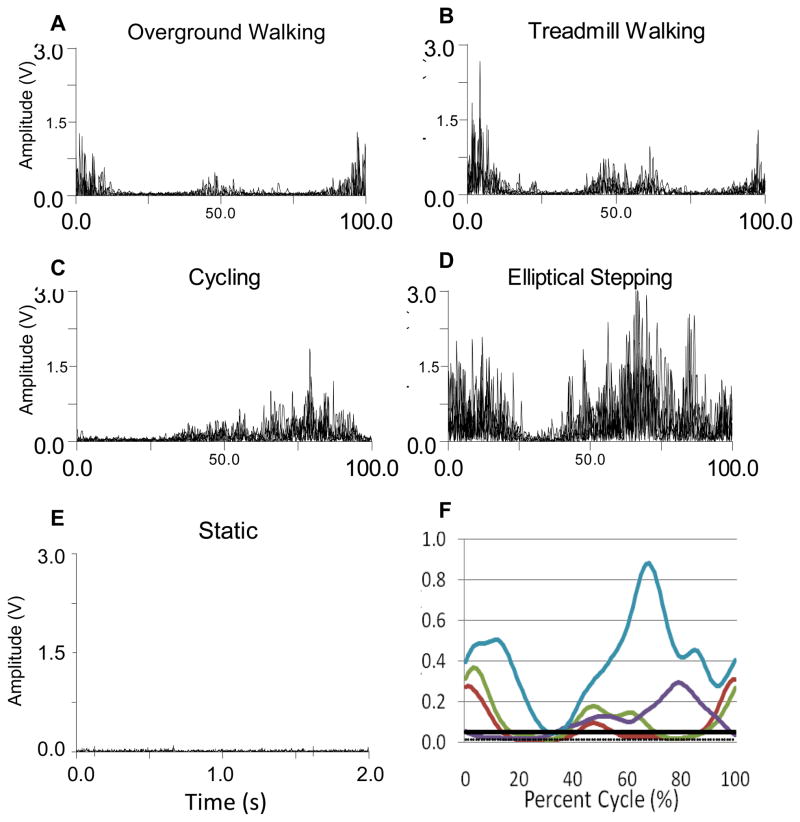
Figure 1.
Representative rectus femoris data for one participant for all conditions. A. Overground walking rectified EMG signals. B. Treadmill walking rectified EMG signals. C. Cycling rectified EMG signals. D. Elliptical training rectified EMG signals. E. Static rectified EMG signal. F. Linear envelope of EMG during all conditions (average of 5 cycles) with static mean and activation threshold. (W-red, T-green, C-purple, E-blue, threshold-solid black, static mean-dotted black).

