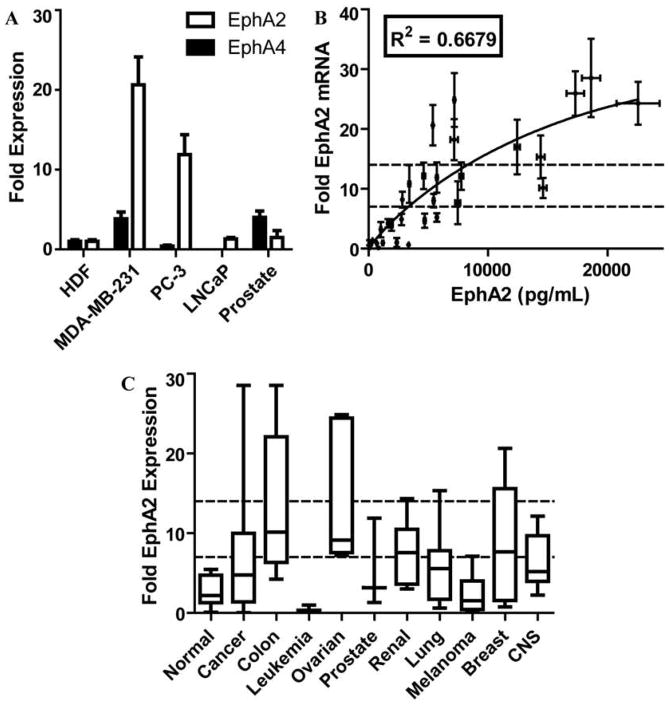
Figure 1. EphA2 and EphA4 expression in 68 human cancer cell lines and 17 normal tissue RNA samples.
(A) EphA2 and EphA4 receptor expression in normal and cancer cell lines. Bar graph shows the fold expression of both EphA2 and EphA4 receptors in MDA-MD-231, PC-3, and LNCaP cancer cell lines compared to cultured human dermal fibroblast (HDF) and to a total human prostate RNA sample (Prostate). (B) Correlation between EphA2 mRNA expression and EphA2 protein levels in 30 selected human cancer cell lines. (C) Box and Whisker plots of the 10–90th percentile of EphA2 expression for the RNA samples grouped according to their tissue of origin. Dotted lines depict cutoffs for 7 fold, and 14 fold the expression levels observed in the reference HDF cell line, respectively.

