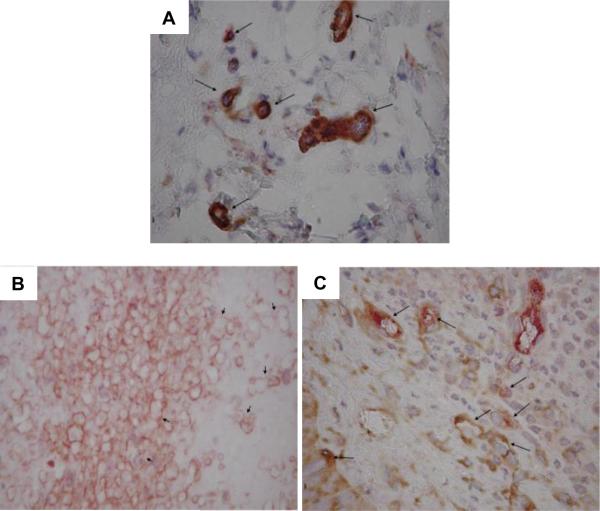
Figure 4.
Representative images of microvasculature stained for smooth muscle α-actin (α-SMA, brown) and von Willebrand factor (vWF, red) at 7 days post-surgery. The contralateral ear (A) exhibited mature vasculature (microvessels indicated by long arrows). HA:HP-VEGF treated tissue exhibited the least mature vasculature at 7 days post-surgery (B, hyperfused vessels indicated by short arrows). HA:HP-VEGF+KGF treated tissue (C) exhibited the most mature vasculature of all 7 day experimental cases (vessels indicated by long arrows). Magnification: 400×. Reproduced with permission,89 Copyright 2008, Elsevier.

