
Fig. 2.
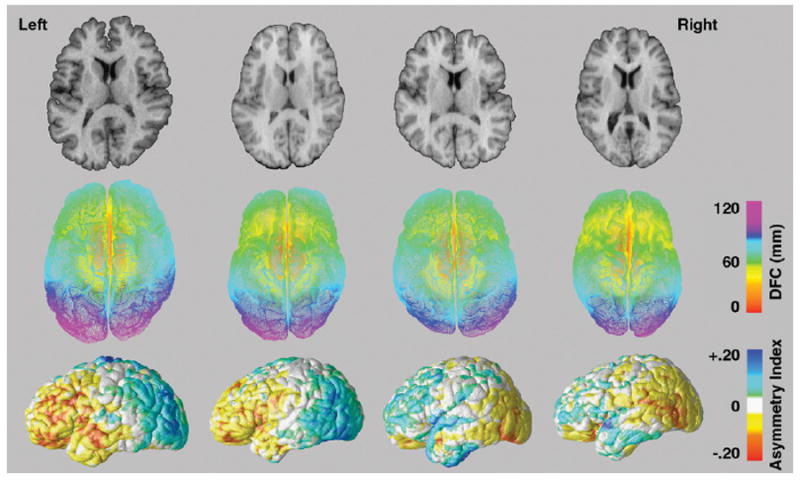
The top row shows axial brain slices from two brain volumes exhibiting the typical patterns of right frontal and left parieto-occipital cerebral torque (left) and brain slices from two brain volumes that show reversals in the typical patterns of cerebral torque (right). The second row shows radial distance or DFC measurements encoded in color at thousands of locations on the left and right hemispheric surfaces corresponding to each brain volume above. The last row shows asymmetry indices of DFC measures projected onto the average surface of the left and right hemisphere flipped along the x-axis for each respective brain volume. Warm colors indicate right hemisphere biased surface expansions while cool colors index left hemisphere biased hemispheric torque.