
Figure 2. Quantitative characterization of cardiac myocytes from lateral (LAT) and anterior (ANT) left ventricle of normal canine.
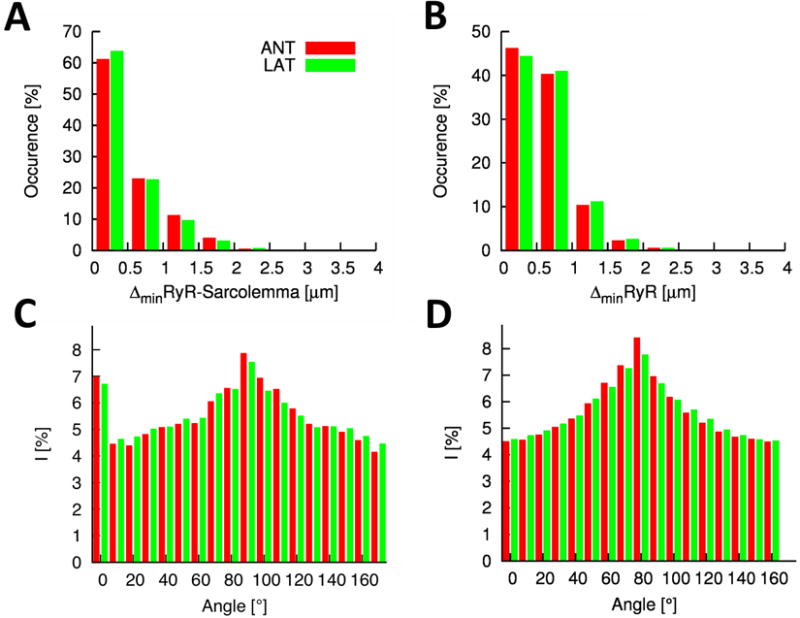
A, Histogram of distances between RyR clusters and the closest sarcolemma. The majority of RyR clusters is in close proximity of the sarcolemma. B, Histogram of distances of RyR clusters to their nearest neighbor. Fourier intensities of C, WGA and D, RyR labeled image stacks. Both intensity distributions exhibit a maxima close to 90° corresponding to y-axis components of the spectrum.