
Figure 4. Characterization of cardiac myocytes from left ventricle of canine after CRT.
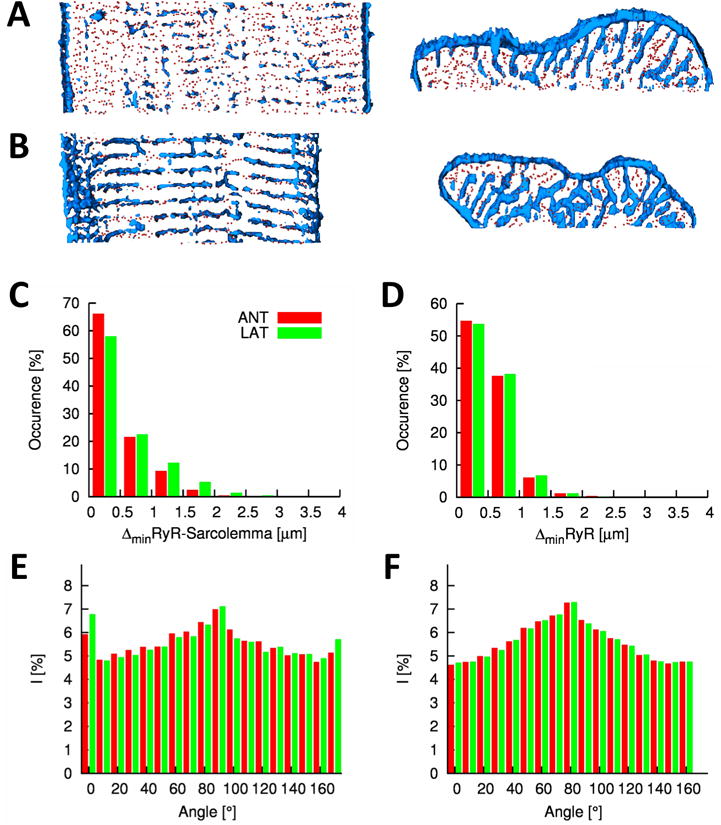
Deconvolved confocal microscopic images and 3D reconstructions of segment of A, anterior and B, lateral cells. Histogram of C, distances between RyR clusters and the closest sarcolemma and D, distances of RyR clusters to their nearest neighbor. Fourier intensities of E, WGA and F, RyR labeled image stacks.