
Figure 5. Structural characterization of control, DHF and CRT cells.
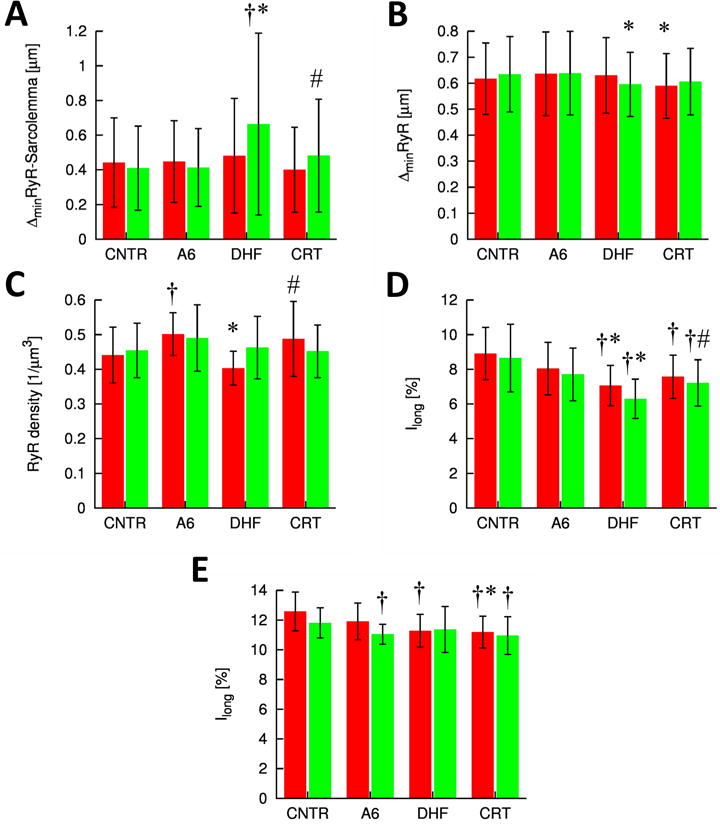
A, Distances of RyR clusters to closest sarcolemma. B, Nearest neighbor distances of RyR cluster centers. C, Density of RyR clusters. The t-system and RyR arrangement were characterized in D, WGA and E, RyR image stacks, respectively, by the normalized magnitudes of longitudinal frequency. † p<0.05 versus control, * p<0.05 versus A6, # p<0.05 versus DHF.