
Figure 6. Characterization of Ca2+ transients in control, DHF and CRT cells from lateral left ventricle.
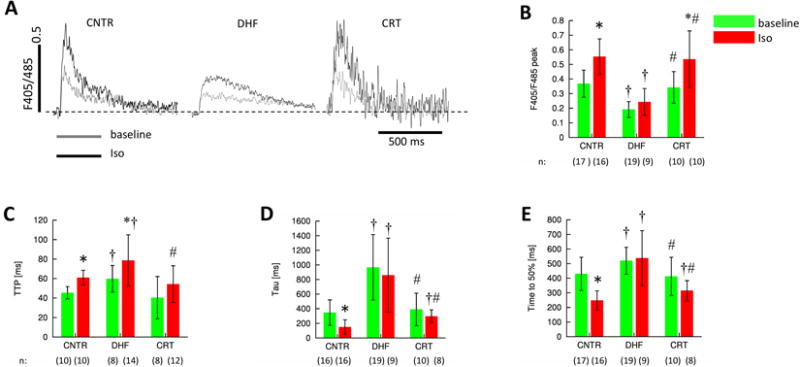
Ca2+ transients were evoked by field stimulation and measured by indo-1 fluorescence. A, Representative ratio-ed fluorescent signals at base line and after application of isoproterenol. Analyses of these signals yielded B, peak amplitudes, C, time to peak (TTP), D, the time constant (tau) of the Ca2+ transient decay, and E, the time to 50% decay. DHF cells exhibit slowed and attenuated Ca2+ transients, which are normalized by CRT. † p<0.05 versus control, # p<0.05 versus DHF, * p<0.05 versus baseline. n: Number of cells.