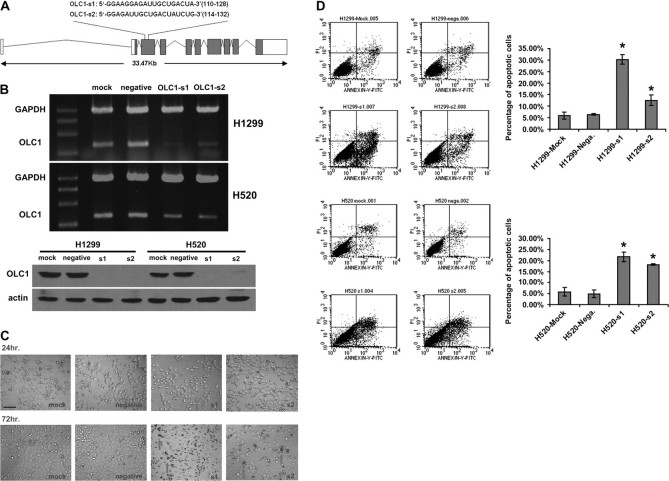
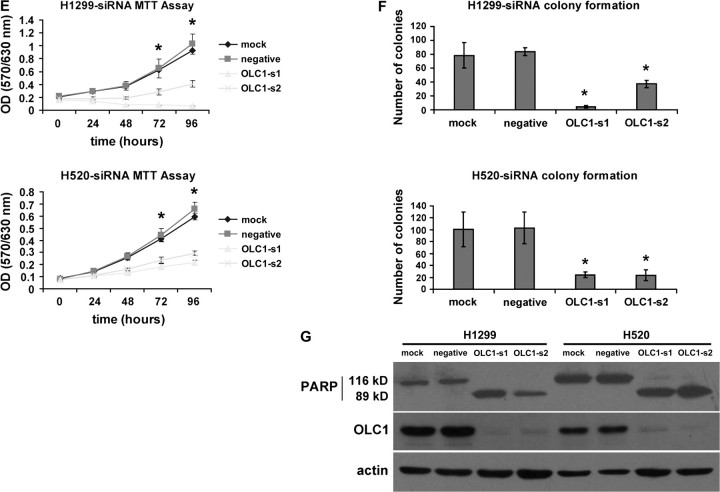
Figure 5.
Effect of overexpressed in lung cancer 1 (OLC1) knockdown with small interfering RNAs (siRNAs) on lung cancer cell lines H1299 and H520. A) Schematic representation of two siRNAs (si1 and si2) against OLC1. The sense sequences are shown. B) OLC1 knockdown in H1299 and H520 cells. Top, reverse transcription polymerase chain reaction analysis performed at 48 h after siRNAs transfection. Bottom, OLC1 protein detected by immunoblotting using a polyclonal rabbit anti-OLC1 antibody 72 h after siRNAs transfection. Cells that were transfected with no siRNA (mock) or a scrambled siRNA (negative) were used as negative controls. C) Apoptosis in H1299 cells at 72 h after transfection with OLC1-s1 and -s2 by as observed by optical microscopy. Arrows indicate the shrinking apoptotic cells. Scale bar = 50 μm. D) Left, flow cytometric analysis of H1299 and H520 cells stained with annexin-V-fluoroisothiocyanate (FITC) and propidium iodide (PI). Cells were harvested 72 h after siRNA transfection. Right, the percentage of apoptotic cells represents the percentage of annexin-V–positive cells. Means from two independent experiments and 95% CIs (error bars) are shown. Error bars represent 95% CIs of the two experiments (*H1299 cells: s1 vs negative, P = .002; s1 vs mock, P = .003; s2 vs negative, P = .035; s2 vs mock, P = .042. H520 cells: s1 vs negative, P = .007; s1 vs mock, P = .009; s2 vs negative, P = .004; s2 vs mock, P = .006; Student two-sided t test). Similar results were obtained in two separate experiments. E) The tetrazolium salt 3-(4,5-dimethylthiazol-2-yl)-2,5-diphenyltetrazolium bromide proliferation assay of siRNA-transfected, mock, and negative H1299 and H520 cells. Error bars represent 95% CIs from one representative experiment with six replicates of three independent ones. *s1 or s2 vs negative, P < .001. F) Colony formation assay of siRNA-transfected, mock, and negative H1299 and H520 cells. Error bars represent 95% CIs from one representative experiment performed in triplicate of three independent ones (*H1299 cells: s1 vs negative control, P < .001; s1 vs mock control,P = .001; s2 vs negative control, P < .001; s2 vs mock control, P = .014. H520 cells: s1 vs negative control, P = .005; s1 vs mock control, P = .007; s2 vs negative control, P = .005; s2 vs mock control, P = .008; Student two-sided t test). G) Immunoblot analysis of PARP cleavage using a rabbit polyclonal anti-PARP antibody 72 h after transfection. Cells were transfected with OLC1 siRNAs (OLC1-s1 and -s2), with no siRNA (mock), or with a scrambled siRNA (negative). Blots were probed with polyclonal rabbit anti-OLC1 and with anti–β-actin as a control for protein loading and transfer. One representative of three independent experiments is shown.


