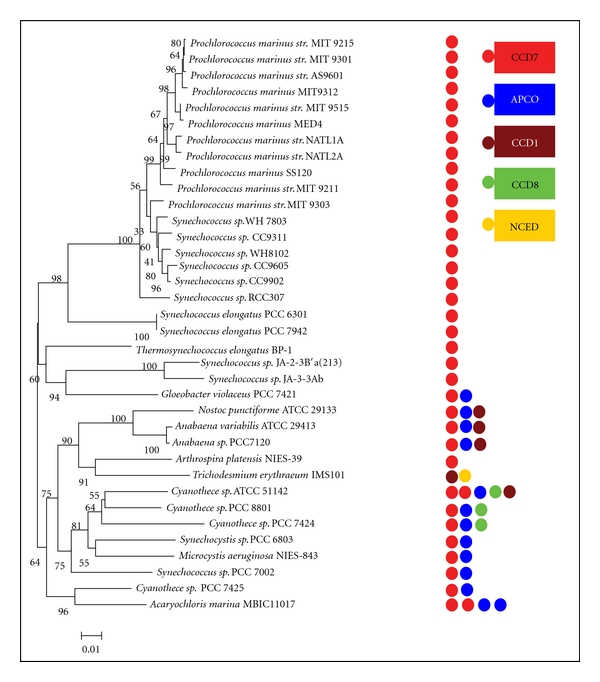
Figure 1.

Phylogenetic tree of the sequenced cyanobacterial strains and the distribution of ccd sequences genes. Left: 37 fully sequenced cyanobacteria strains were performed based on 16 s rRNA as described in the methods section. An identical topology was obtained with two different methods (ML, NJ) and different models applied (for ML, generalized time reversible (GTR); for NJ, Kimura 2-parameter). Numbers at the node indicated bootstrap values (%) for 1,000 replicates. Right: the distribution of ccd genes across 37 cyanobacterial strains. Circular boxes represented the different ccd sequences that were labeled in the distinct color. The numbers of ccd sequences were presented by the numbers of circular boxes.
