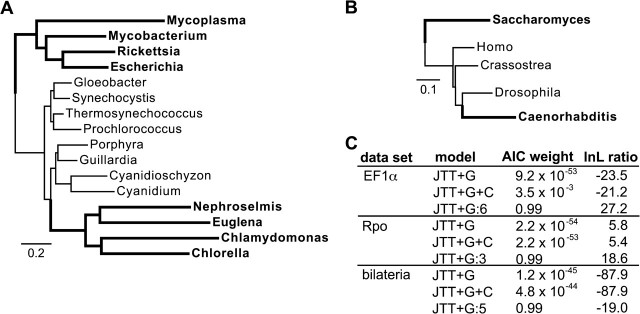
FIG. 7.—
Mixed branch length model increases support for correct phylogenetic relationships. We analyzed 3 empirical data sets using both homotachous and mixed branch length models. (A) The correct 16-taxon Rpo phylogeny; the incorrect tree groups the green algal plastids with nonphotosynthetic bacteria (shown in bold) (B) The correct bilaterian phylogeny; the incorrect tree places the taxa in bold together. (C) We calculated the log-likelihood ratio (lnL) of the correct versus incorrect phylogenies. Positive lnLs indicate support for the correct tree, whereas negative values indicate support for the wrong tree. AIC weights indicate the inferred support for each model. The correct and incorrect trees for EF1α are shown in figure 4. Models used were homotoachous with gamma-distributed among-site rate variation (JTT+G), covarion (+C), or the mixed branch length model (:n, where n is the best-fit number of branch-length categories using AIC).

