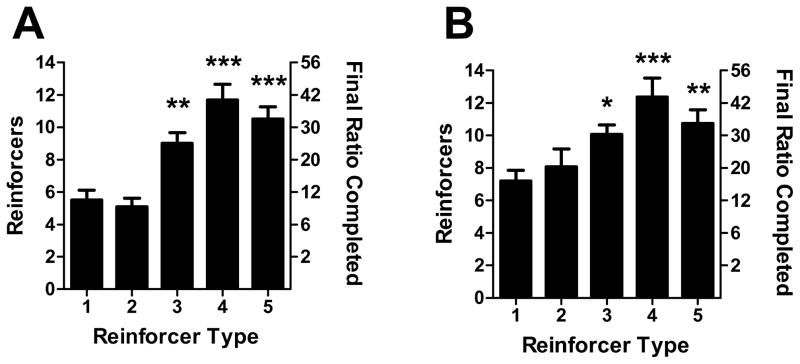
Figure 2.
Progressive ratio responding for sensory stimuli. A. Between-groups comparison: mice were tested for progressive ratio responding for the same stimulus type as for FR-1. B. Within-groups comparison: mice that responded for type 5 stimuli in FR-1 sessions were subsequently tested for PR responding for all 5 stimulus types. Bars represent mean ± SEM. *p<0.05, **p<0.01, ***p<0.001.

