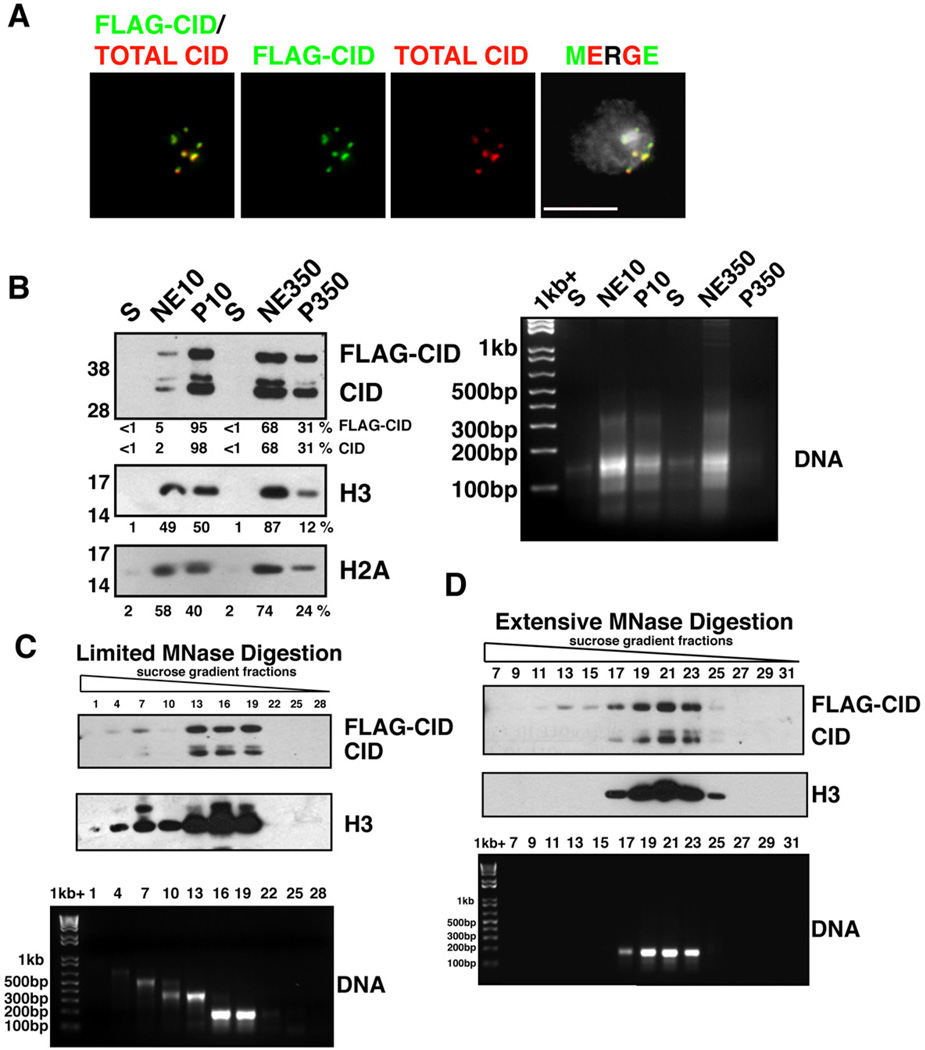
Figure 1. Characterization of CID chromatin.
- FLAG-CID (green) and total CID (red) colocalize at centromeres in a stable S2 cell line. FLAG-CID and total CID were stained by α-FLAG and α-CID antibodies, respectively. DNA staining by DAPI (grey). Scale bar = 5 µm.
- (left) FLAG-CID and endogenous CID are more resistant to salt extraction than H3. After MNase digestion, soluble nucleoplasmic fractions (S), chromatin extracted with either 10 mM or 350 mM salt (NE10 and NE350, respectively), and insoluble nuclear pellets (P10 and P350, respectively) were analyzed by Western blots for CID, H3 and H2A. (right) DNA agarose gel with the same samples.
- (top) FLAG-CID and endogenous CID co-fractionate with peaks of H3 in sucrose gradient fractions after limited MNase digestion. (bottom) DNA agarose gel shows sizes consistent with mainly mono-, di- or tri-nucleosomes.
- (Top) FLAG-CID and endogenous CID co-migrate with H3 in sucrose gradient fractions after extensive MNase digestion. (bottom) DNA agarose gel from the same samples.
Also see Figure S1.

