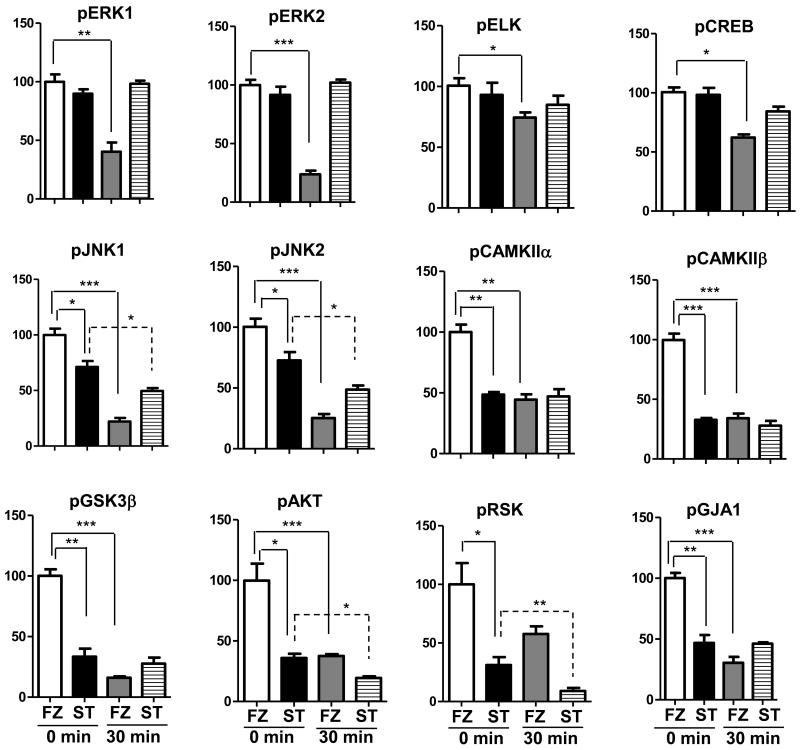
Figure 5. Unchanged levels of phospho-proteins in cortical lysates from heat stabilized tissue and decreased levels in frozen tissue with room temperature incubation.
Signals from replicate Western blots as in Figure 4 were normalized to actin. Histograms represent average values for each group of samples relative to 100% for frozen tissues at 0 min RT (white bars); black bars, stabilized tissues 0′ RT; grey bars, frozen tissues 30′ RT; striped bars, stabilized tissues 30′ RT. Errors bars are the standard error of the mean. Statistical significance was determined by the unpaired Student's t-test. *p<0.05; **p <0.001:***p <0.0001.

