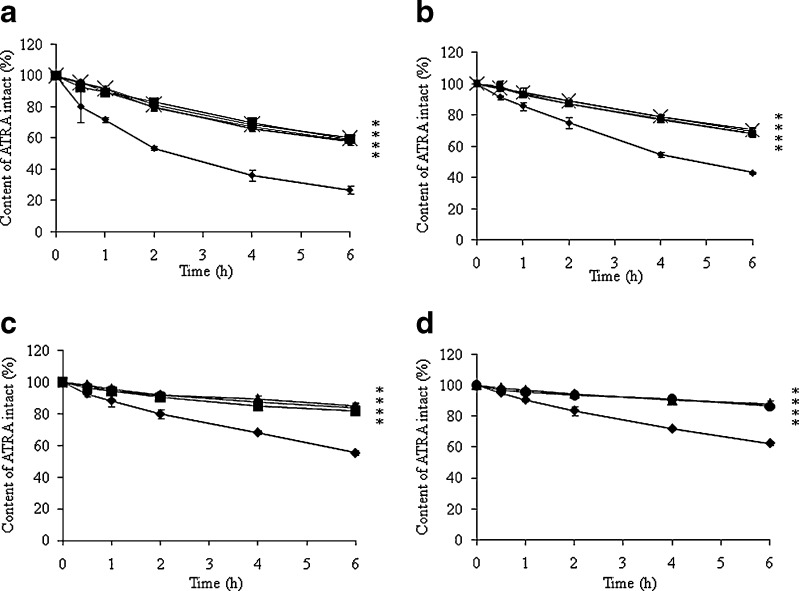
Fig. 3.
Effect of UVA exposure on the chemical stability of ATRA-loaded NLCs with different oil phases; (ex symbol) S/CP, (filled square) M/CP, (filled upright triangle) S/O/CP, (filled circle) M/O/CP compared with (filled diamond) ATRA in an isopropyl alcohol solution (IPA) with different initial ATRA concentrations; a 1 mg/g, b 3 mg/g, c 5 mg/g and d 7 mg/g. * significantly different (p ≤ 0.05) when compared with ATRA in IPA

