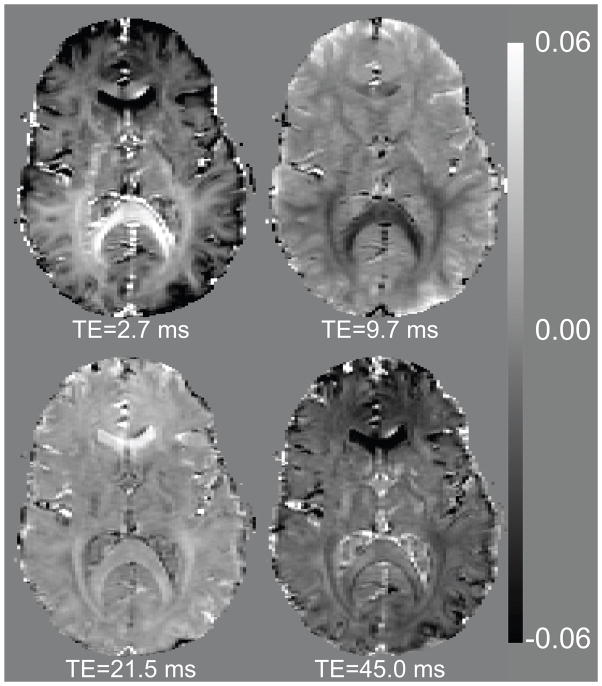
Figure 1.
The difference between a mono-exponential model and the T2*-weighted data at four selected echo times, as fraction of the fitted amplitude for echo time zero. The echo times are indicated below each image. The images show that the deviation from exponential behavior is not limited to the contribution of a fast component, and notably different in contrast for different anatomical structures.

