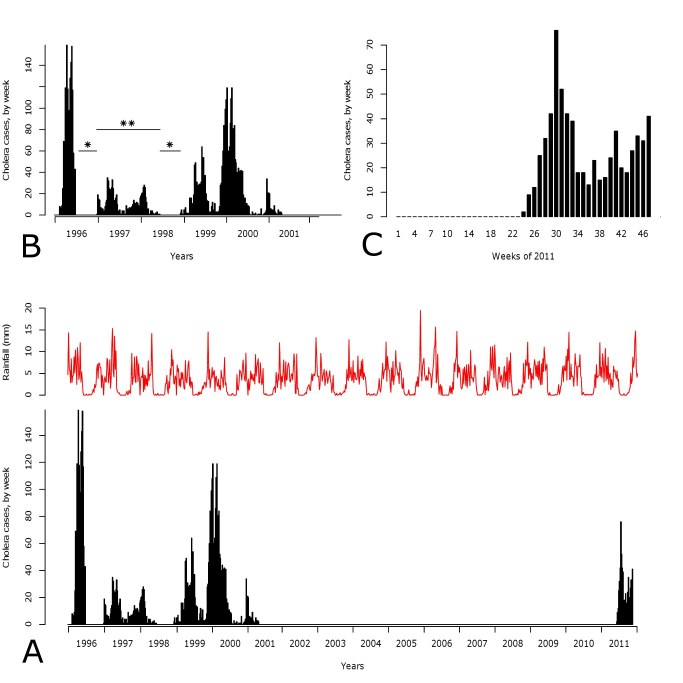
Figure 2. Weekly Reported Cases and Estimated Rainfall 1996-2011. Cholera cases and estimated mean daily rainfall (in mm) by week for the period of 1996-2011 (A). Inset B highlights the 1996-2001 epidemic, indicating the periods of compromised surveillance data quality (** data available only from 1 reporting facility, * absence of data). Inset C highlights the ongoing 2011 epidemic as of week 47.

An official website of the United States government
Here's how you know
Official websites use .gov
A
.gov website belongs to an official
government organization in the United States.
Secure .gov websites use HTTPS
A lock (
) or https:// means you've safely
connected to the .gov website. Share sensitive
information only on official, secure websites.
