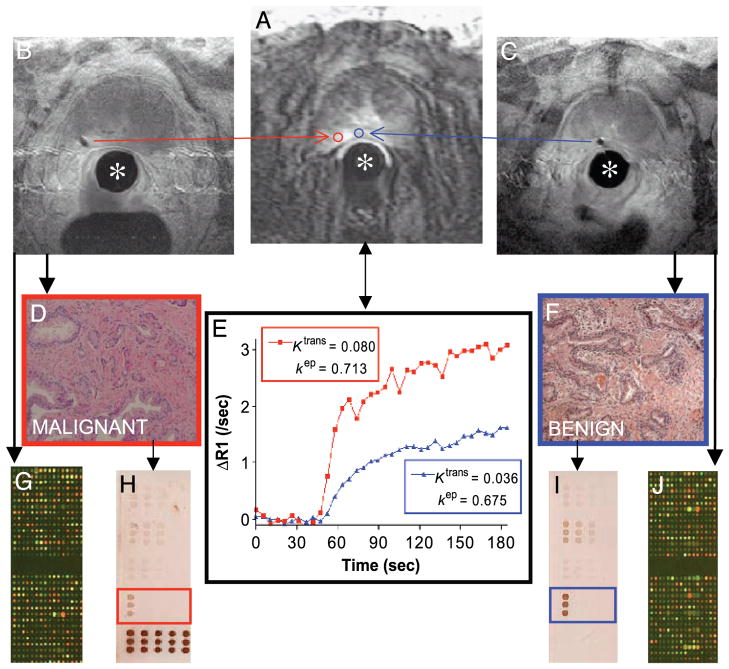
Figure 1.
Case example demonstrating the feasibility and integration of prostate interventional MRI for the correlation of molecular biology and DCE-MRI. The stationary interventional endorectal coil (*) is used for both diagnostic and interventional MR imaging. (A) DCE-MRI at 120 sec shows a small area of increased signal intensity in the left peripheral zone of the prostate. ROIs (red and blue) corresponding to the subsequent needle biopsy voids (B and C) are defined for image analysis. (E) Time – intensity curves (corrected for T1 heterogeneity) from each ROI are fit to a GKM convolution integral using an arterial input function measured from the external iliac artery. The transfer constant Ktrans (corresponding to the magnitude of the enhancement curve, unit min−1) and the rate constant kep (describing the rate of clearance, unit min−1) are thought to reflect differences in the perfusion and microvascular permeability underlying each ROI, respectively [2]. H&E staining shows adenocarcinoma (D) corresponding in this case to higher Ktrans and kep than benign tissue (F). cDNA microarray (G and J) and reverse-phase protein array (H and I; array probed with STAT3 antibody shown) analysis can be performed on the biopsy cores.

