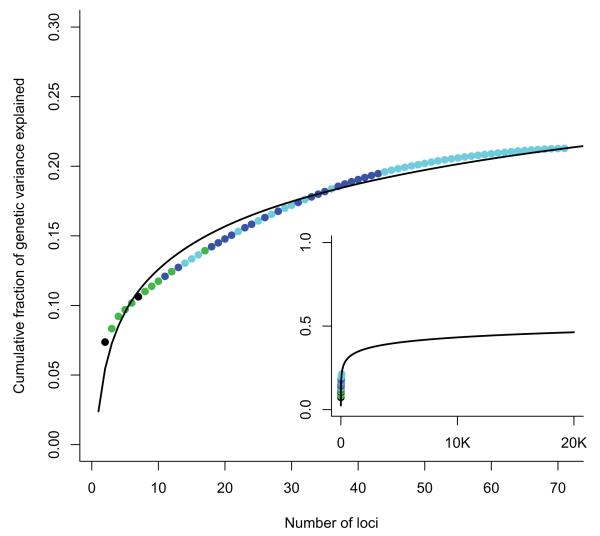
Figure 2. Cumulative fraction of genetic variance explained by 71 CD loci.
Cumulative fraction of genetic variance explained by the 71 CD loci reported here, ordered from largest to smallest individual contribution. Black points were identified pre-GWAS, green in first generation GWAS, blue in an earlier meta-analysis and cyan in this analysis. Inset shows a logarithmic fit to these data extrapolated to an extreme scenario where 20,000 independent common alleles are associated with disease. Even in this situation less than half of the genetic variance would be explained. This demonstrates that other types of effect (e.g. less common and rare alleles with higher penetrance) must also exist.

