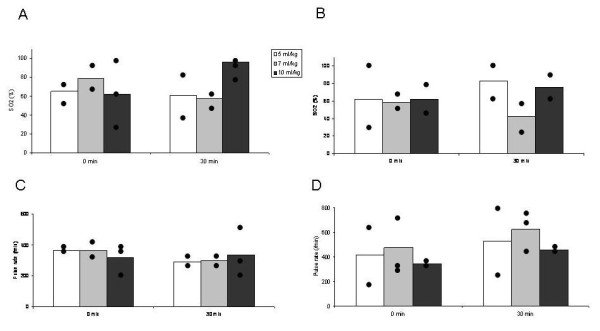
Figure 1.

Oxygen saturation (A, B) and pulse rate (C, D) immediately after the beginning of mechanical ventilation (0 min) and after 30 min (30 min) with different tidal volumes without (A, C) and with addition of PEEP (B, D). Bars represent mean values of 2 or 3 animals per group. Dots show individual values to demonstrate the high variability in measurements.
