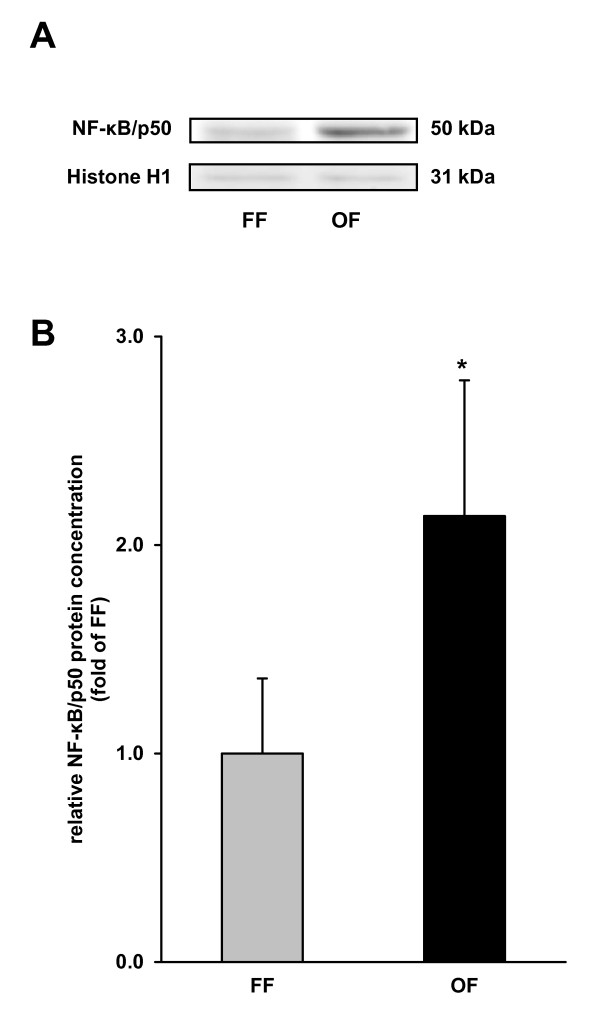
Figure 3.
Nuclear concentration of NF-κB/p50 in the liver of pigs fed either a fresh fat or an oxidized fat. (A) Representative immunoblots specific to NF-κB/p50 and Histone H1 for normalization are shown for one sample per group. Immunoblots for the other samples revealed similar results. (B) Bars represent data from densitometric analysis and represent means ± SD (n = 6/group). Bars represent fold of relative protein concentration of the fresh fat group. *Different from pigs fed the fresh fat diet, P < 0.05. FF, fresh fat group; OF, oxidized fat group.

