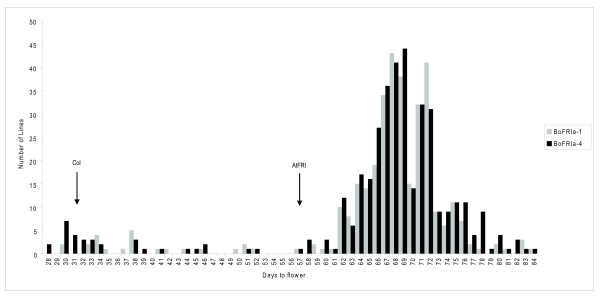
Figure 5.
Distribution of flowering times in T1 transformants carrying BoFRIa-1 and BoFRIa-4 alleles. Histogram of the flowering time of T1 lines transformed with BoFRIa-1 and BoFRIa-4 measured as days to flower. The flowering time of wild type Col-0 plants and Col-0 transformed with AtFRI are indicated.

