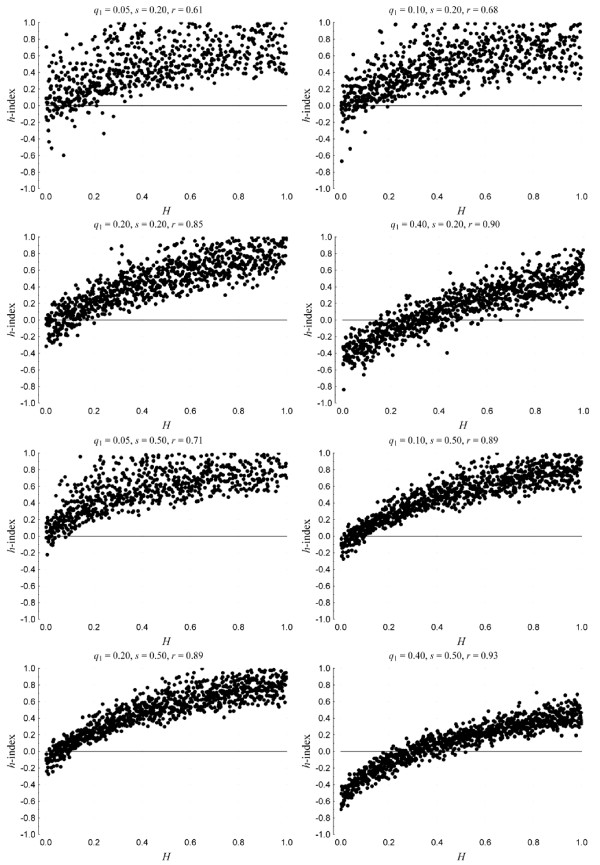
Figure 3.
Performance of the h-index against the true underlying mode of inheritance given by parameter H for allele frequencies in the range (0.05 ≤ q1 ≤ 0.4 and selection coefficient s = 0.2 and 0.50, when 400/400 controls/cases are sampled from the parametric cohort. Each plot also gives the Spearmann correlation between H and h-index.

