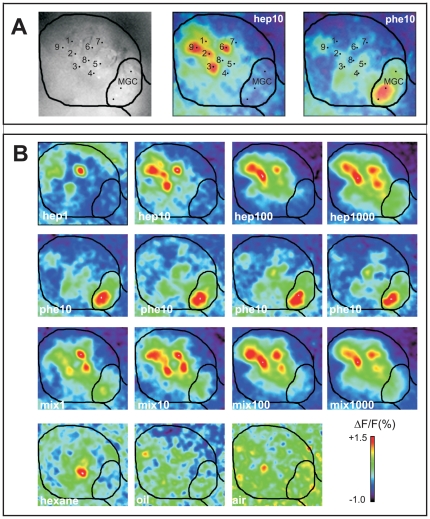
Figure 3. Odour-evoked calcium signals in the antennal lobe.
A) Example of an anatomical staining of a right antennal lobe (AL) with the outline of the entire AL and MGC. Two activity maps obtained in response to heptanal (10 µg) (hep10) and to the pheromone blend (10 ng) (phe10) are shown with the outline of the AL. Numbers next to dots indicate the position of the nine analysed ordinary glomeruli (1–9), as well as three analysed locations within the MGC, for which activity was pooled. B) Activity signals obtained in a mated male stimulated with four doses of heptanal (hep) (1–1000 µg), four presentations of pheromone (phe) at 10 ng, and the respective pheromone/heptanal mixtures (mix). All maps are scaled to the same minimum/maximum.

