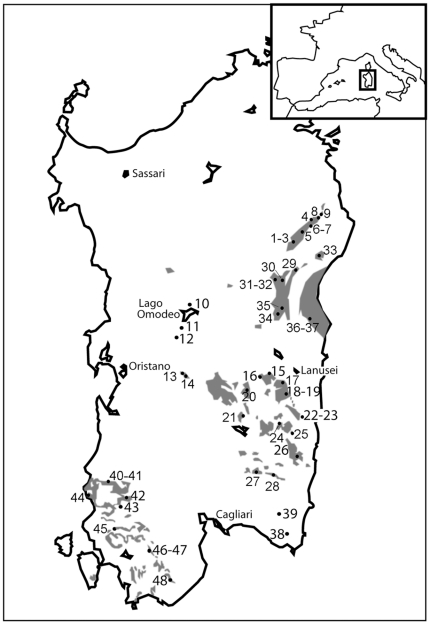
Figure 1. Map of sampling sites in Sardinia.
Sampling localities are indicated with numbers corresponding to populations described in Table 1. The smaller insert, top right, indicates the geographic location of Sardinia Island. Populations: 1–9, H. flavus; 10–28, H. imperialis; 29–37, H. supramontis; 38–39, H. sarrabusensis; 40–48, H. genei. Localities 18–19, 22–23, 40–41, and 46–47 are indicated together due to the small size of the map, but they are separated from each other by several km. Major calcareous areas of the island are indicated in grey.

