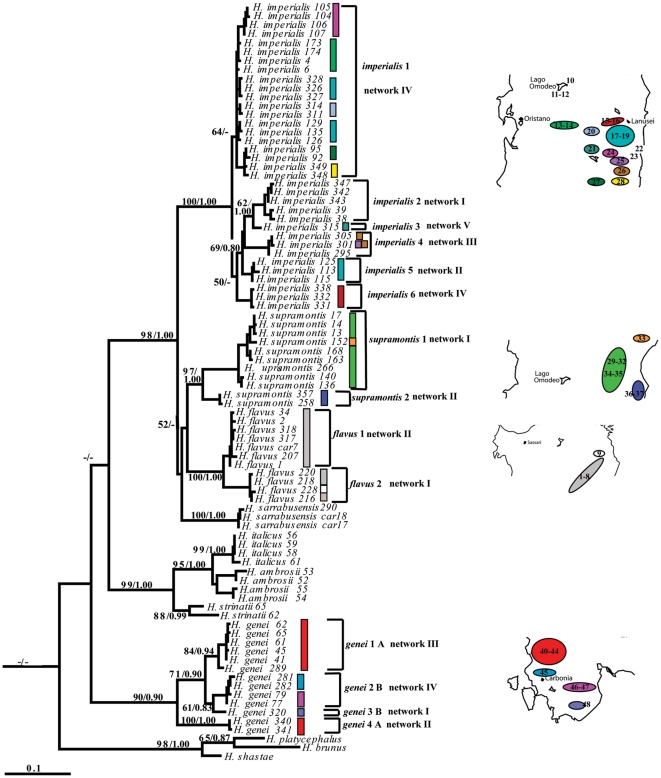
Figure 2. Phylogenetic reconstruction.
Phylogenetic Maximum Likelihood tree with bootstrap support and Bayesian posterior probabilities indicated at the nodes. Divergent clades within each species further investigated for genetic distances are indicated with the species name and the clade number next to the tree. Network correspondence (as in Figures 5 and 6) is indicated next to each clade. Differently colored bars next to the haplotype names indicate distinct calcareous areas as shown in the maps next to the tree. Numbers on the maps refer to sampling localities (Table 1). Bootstrap values and posterior probabilities below 50 and 0.7, respectively and outgroups are not shown.

