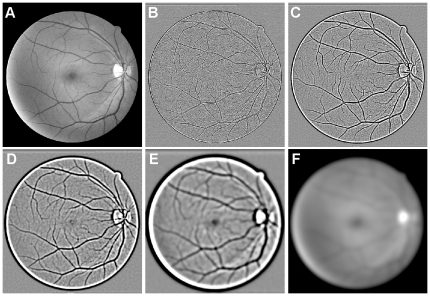
Figure 1. Wavelet levels and the final scaling coefficients calculated from four iterations of the IUWT.
(A) The original image from the DRIVE database. (B–E) Wavelet levels 1–4, computed using the IUWT algorithm. Wavelet coefficients have been scaled linearly for display, so that light and dark pixels indicate positive and negative coefficients respectively, while zero is represented by a mid-tone gray. (F) The smooth residual image. Adding this residual to all the wavelet levels would reconstruct the original image.

