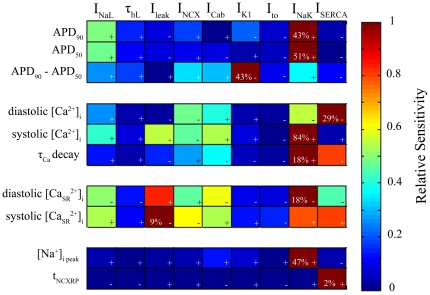
Figure 5. Relative sensitivities of the electrophysiological parameters to changes in ionic current properties.
Dark blue color indicates lack of dependency between the ionic property (1st row) and the EP parameter (1st column), and dark red color indicates strong direct (+) dependency or inverse dependency (−). Percents in each box indicate the maximum absolute sensitivity of the EP parameter correspondent to that row for all ionic properties.

