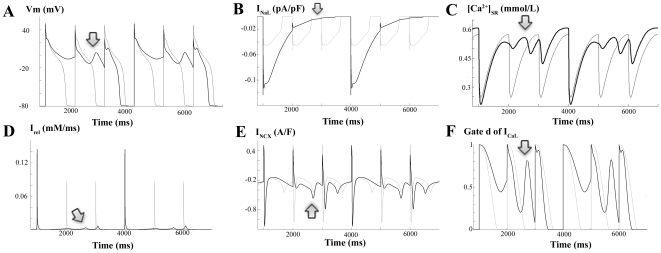
Figure 8. Mechanisms for early afterdepolarizations with enhanced INaL.
Simulated APs and ionic currents at a stimulating rate of 1 Hz for HF conditions, 50% inhibition of IKr and 30% increase of ICaL. Panel A shows early afterdepolarizations (EADs; dark line) when INaL was doubled and APs with no EADs when INaL was normal (light line). The temporal evolutions of INaL (panel B), Irel (panel D), ICaL (panel C), NCX activity (panel E), and activation gate of ICaL are also depicted when INaL was doubled (dark line) and when INaL was normal (light line).

