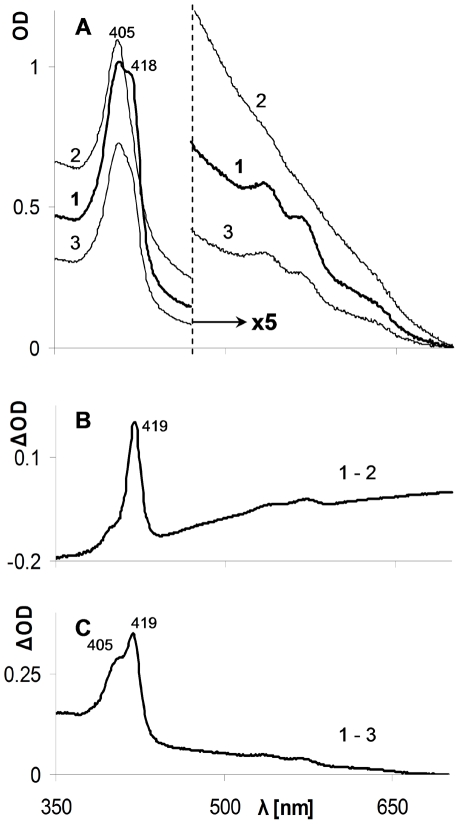
Figure 5. Effect of CO on the interaction of ferric Hb with copper oxidized LDL.
A - Spectra of reaction mixtures incubated ON: Curve 1 - experimental mixture containing ferric Hb, oxLDL and 1 mM CO; Curve 2 – control in which CO was replaced by inert gas in the experimental environment; Curve 3 - control in which oxLDL was replaced by nLDL. Note scale differences of Soret and visible regions. B - Difference spectrum of curves 1 & 2 in A. C - Difference spectrum of curves 1 & 3 in A.

