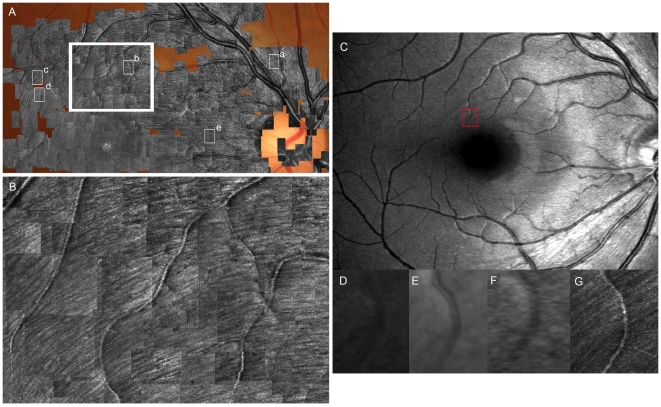
Figure 2. Images of the normal retinal nerve fiber layer (RNFL) using AO-SLO compared with red-free fundus photography and red-free SLO.
A, Wide-field montage of high-resolution AO-SLO images (1.5°×1.5°) within a 30° arc from the foveal center. AO-SLO images show many hyperreflective bundles in the RNFL. The hyperreflective bundles above and below the fovea appear in an arched shape from the temporal periphery on either side of a horizontal dividing line to the optic disc. The hyperreflective bundles on the nasal side of the fovea arch from the fovea to the optic disc. Small white boxes (a–e) indicate the area of high-magnification AO-SLO images in Fig. 5. B, Magnified view of the area outlined in large white box in A showing individual hyperreflective bundles. C, Red-free SLO image of the same eye obtained with an F-10 (NIDEK, Gamagori, Japan). The hyperreflective bundles on AO-SLO (A, B) correspond with the direction of the striations on the SLO red-free image. D, Magnified blue-channel fundus photography image of the area inside the box in C. E, Magnified red-free SLO image (HRA2; Heidelberg Engineering, Heidelberg, Germany) of the area inside the box in C. F, Magnified red-free SLO image (F-10) of the area inside the box in C. G, Magnified AO-SLO image of the area inside the box in C. The resolution and contrast of the bundles are much higher in the AO-SLO images (G) than in red-free fundus photography (D) or the red-free SLO images (E, F).

