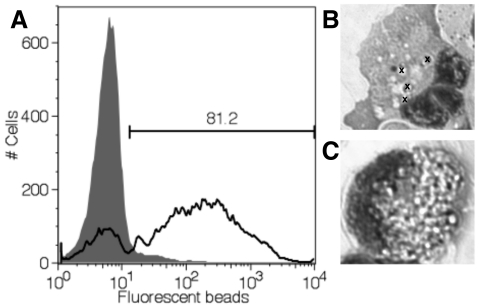
Figure 4. tDCs are phagocytic.
(A) Fluorescence of tDCs incubated for 2 hours with 1 µM opsonized fluorescent latex beads (black line) compared to tDCs alone (grey filled histogram). Gate indicates percent phagocytic cells (81.2%). Representative data are shown (mean percent phagocytic tDCs for experiment was 68.6%, n = 5). Experiment was repeated 2 times. (B) Cytospin showing internalized beads (beads indicated by “x”) in a representative tDC, compared to a representative macrophage (C) under the same conditions (too many beads to mark).

