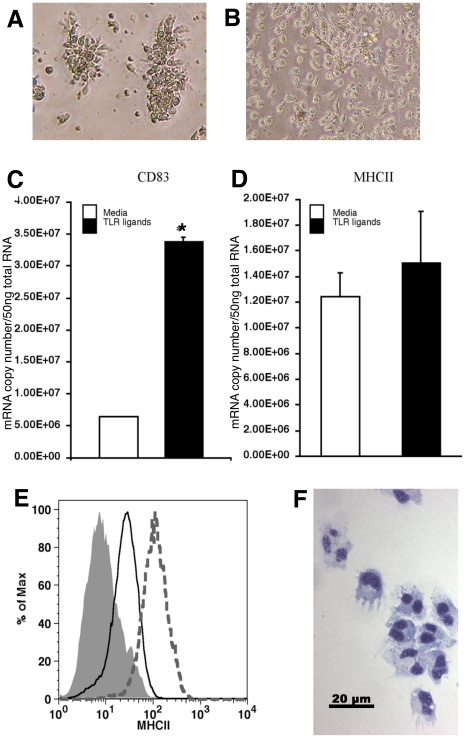
Figure 7. Activation of tDCs by TLR-ligands.
Phase contrast images show aggregation of tDCs typical of activated leukocytes after 24 hrs incubation with TLR-ligands (A), while tDCs in medium alone remained randomly distributed (B). tDC CD83 mRNA copy numbers, measured by real-time RT-PCR, increase significantly (*p<0.05) compared to media controls at 24 hrs of exposure to TLR-ligands (C), while MHCII mRNA copy numbers are not significantly changed (D). However, after 4 day incubation with TLR-ligands, tDCs upregulate surface expression of MHCII (E), (grey dotted histogram: TLR-ligand treated tDCs, black line histogram: media control tDCS, and grey filled histogram: pre-immune serum control) and by cytospin take on a morphology strikingly similar to mammalian DCs (F).

