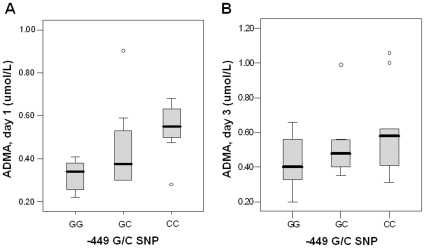
Figure 4. Relationship between plasma ADMA concentration and the DDAH2 −449G/C genotype in septic patients.
Plasma ADMA concentrations differed according to −449G/C genotype on day 1 but not day 3. ADMA was highest in septic patients with −449CC homozygous genotype, intermediate in −449GC heterozygotes, and lowest in the GG homozygotes on day 1 (p = 0.01, panel A). While a similar trend in plasma ADMA was observed on day 3, the difference was not significant (p = 0.33, panel B).

