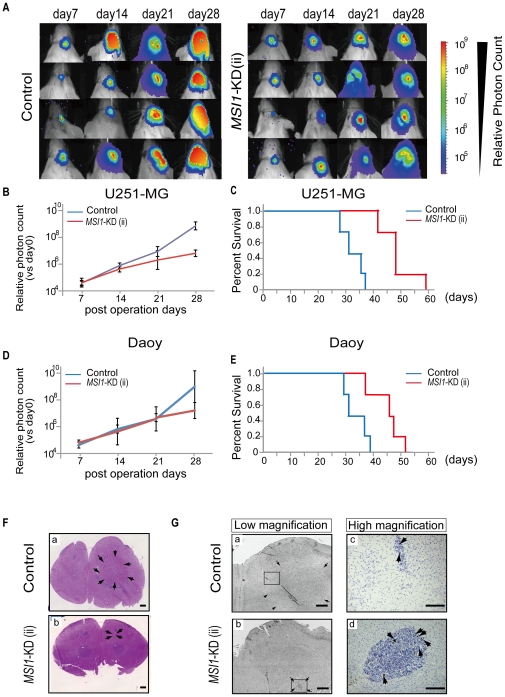
Figure 3. Xenografts expressing MSI1-KD showed reduced BLI and longer survival.
Briefly, 1×10⁴ human glioblastoma cells were transplanted into the right striatum of NOD/SCID mice (n = 4), and tumor growth was monitored in live animals. The MSI1-KD group exhibited better survival than the control group (n = 4, *P<0.05). (A) Representative BLI images of mice receiving implants of MSI1 shRNA lentivirus-transfected U251MG cells on day 28. (B&D) Relative photon count of BLI compared with that day0 was shown. The tumor average photon count in MSI1-KD group was inferior to that in control groups in U251MG cells (Fig. 3B) and in Daoy cells (Fig. 3D) (C) Kaplan-Meier survival curves for the control and MSI1-KD mice in U251MG cells (*P<0.05). The survival time in the MSI1-KD group (49.3±6.1 days) was significantly longer than that in the shRNA control group in U251-MG cells (33.6±3.6 days; P<0.01). (E) Kaplan-Meier survival curves for the control and MSI1-KD mice are shown in Daoy cells (*P<0.05). The survival time of the MSI1-KD group (45.5±5.4 days) was significantly longer than that of the shRNA control group in Daoy cells (34.0±4.1 days; P<0.01). (F) Mouse brain transplanted with control cells (F-a) and MSI1-KD cells (F-b) was stained for hematoxylin and eosin (Bar = 1 mm). (G) Brain transplanted with control cells [G-(a, c)] and MSI1-KD cells [G-(b, d)] was immunostained for PH3 [(a, b) Bar = 800 µm (c, d) Bar = 200 µm]. In G-(a, b), surrounding arrows show the transplanted tumor area. G-(c, d) indicated the high magnification images of the squared region of G-(a, b), respectively.

