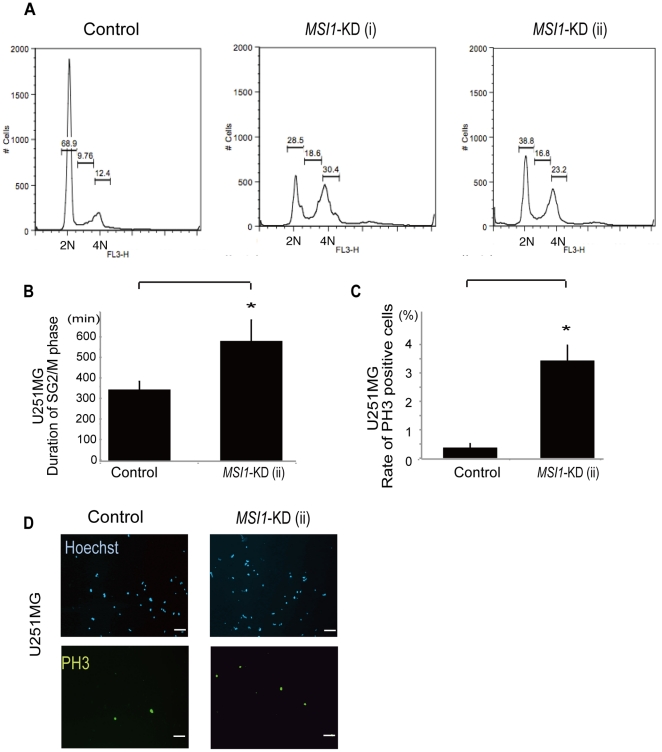
Figure 4. Knockdown of MSI1 induces G2/M arrest.
MSI1-KD cells were analyzed by fluorescence-activated cell sorting. A representative cell-cycle profile for each treatment is indicated. 2N represents the G0–G1 phase and 4N represents the G2/M phase. An increased number of MSI1 KD-positive cells accumulated in the G2/M phase. (B) Time-lapse microscopy using a fluorescent ubiquitination-based cell-cycle indicator (Fucci) probe system showed that MSI1-KD cells retained the green fluorescence for a much longer time (4 days). Error bars represent SEM, *P<0.01.The spheres were dissociated, and the dissociated cells were fixed to coverslips and stained for PH3 in U251MG cells (C and D). Cell counts are plotted as bar graphs. An average of 25 high-power fields was counted. Error bars represent SEM, *P<0.01. (D) Representative images of control cells and MSI1-KD cells stained for PH3 and Hoechst. There were more PH3-positive MSI1-KD cells than control cells. (Bar = 500 µm).

