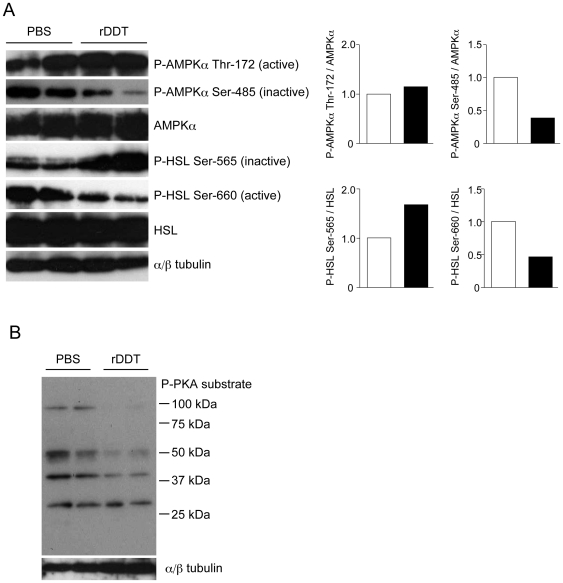
Figure 6. Phosphorylation of HSL, AMPK, and PKA's substrates in the adipose tissues from rDDT-treated db/db mice.
A Phosphorylation of HSL and AMPK in the epididymal adipose tissues removed from each mouse 1 h after the injection of PBS or rDDT. Western blot analysis using indicated antibodies was performed. An image shown is representative of 3 independent experiments. The graph represents band density ratio of each phosphorylated protein to total protein obtained from a left image. White and black bars denote mice injected PBS and rDDT, respectively. The graph represents mean of band density ratio of each phosphorylated protein to total protein in the adipose tissue from db/db mice injected with PBS (white bars) or rDDT (black bars). B Phosphorylation of PKA's substrates in the epididymal adipose tissues removed from each mouse 1 h after the injection of PBS or rDDT. For detection of the phosphorylation of PKA's substrates, antibody recognizing phosphorylated Ser or Thr in the RRXS/T motif was used.

