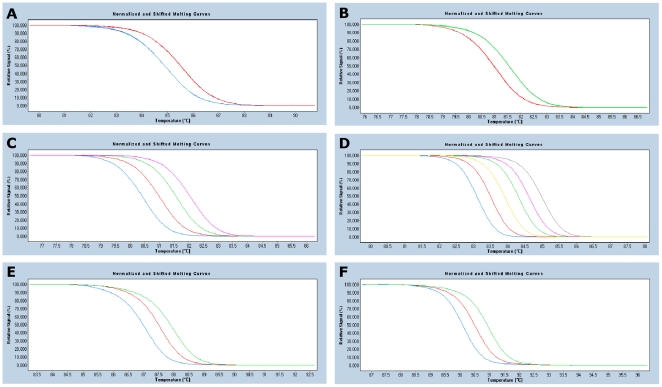
Figure 1. Examples of melting curves for each target region.
. For some target regions not all melting curves were represented among the isolates analysed in this study, therefore not all theoretically possible curves are depicted in the figure. A) Target region infB729, showing two (12, 13) of two predicted melting curves. B) Target region mdh1197, showing two (9, 10) of three predicted melting curves. C) Target region phoE2013, showing four (18, 19, 20, 21) of four predicted melting curves. D) Target region rpoB2227, showing six (41, 42 43, 44, 45, 46) of seven predicted melting curves. E) Target region tonB2693, showing three (39, 40, 41) of seven predicted melting curves. F) Target region tonB2886, showing three (54, 55, 56) of eight predicted melting curves.

