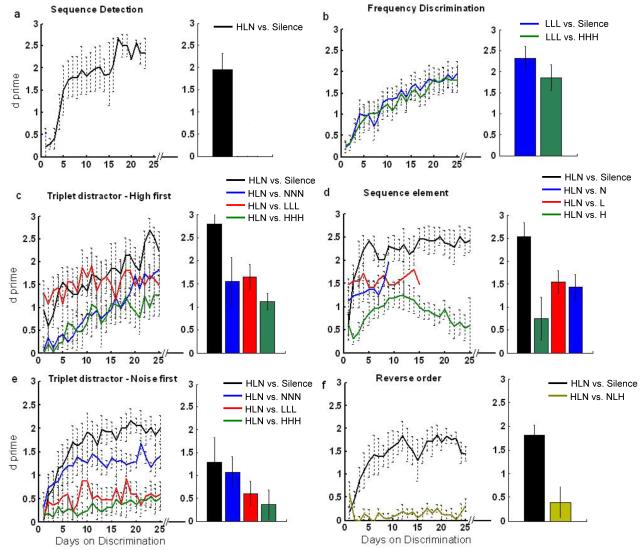
Figure 2.
Detection and discrimination performance. (a) All groups learned not to lever press during silent periods during the first few days of training and continued to correctly reject these catch trials up to the last day of training. The black line represents discrimination between the target sequence and silent catch trials. The bar graphs to the right of each panel represent the average performance on the last day of training. (b&c) The frequency discrimination and high first triplet distractor groups learned to correctly reject each of the distractors presented (p < 0.0001). (d) By the last day of training, the sequence element group was able to correctly reject the noise and the low tone (p < 0.0001), but not the high tone (p > 0.05). (e) The noise first triplet group learned to correctly reject the noise triplet (p < 0.0001), but not the two tone triplets (p > 0.05). (f) The reverse order group was unable to reject the reversed sequence (p > 0.05). Since additional distractors were added at different times during training depending on individual performance, the horizontal axis represents the number of days of training on each distractor. The time course for the sounds was shifted to better compare performance time course across the different sounds. Rats on each task trained for the same total length of time (~ 3 months). Error bars represent standard error of the mean for each group of trained rats. Statistical analyses were paired t-tests between first vs. last day of training.

