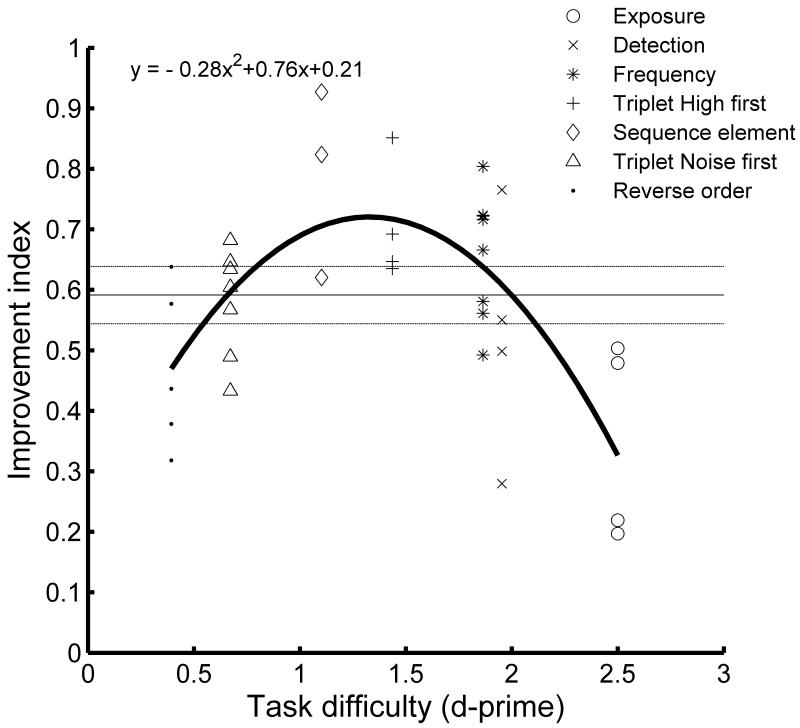
Figure 5.
Relationship between cortical responses and task difficulty. For each rat, the mean values of the response properties shown in figure 4a-d were linearly scaled from 0 to 1 such that a value of 1 denotes the rat with the shortest latency, sharpest tuning, or least suppression whereas a value of 0 was given to the rat with the longest latency, broadest tuning, or most suppression. The improvement index is the average of these four values. The relationship between the improvement index and task performance was best fit by a second order polynomial regression curve which was highly significant (F (2, 35) =14.2, MSE = 0.01, p < 0.0001). Each dot represents a single rat. The horizontal black line and dotted lines are the mean index and standard error of the mean for naïve rats.

