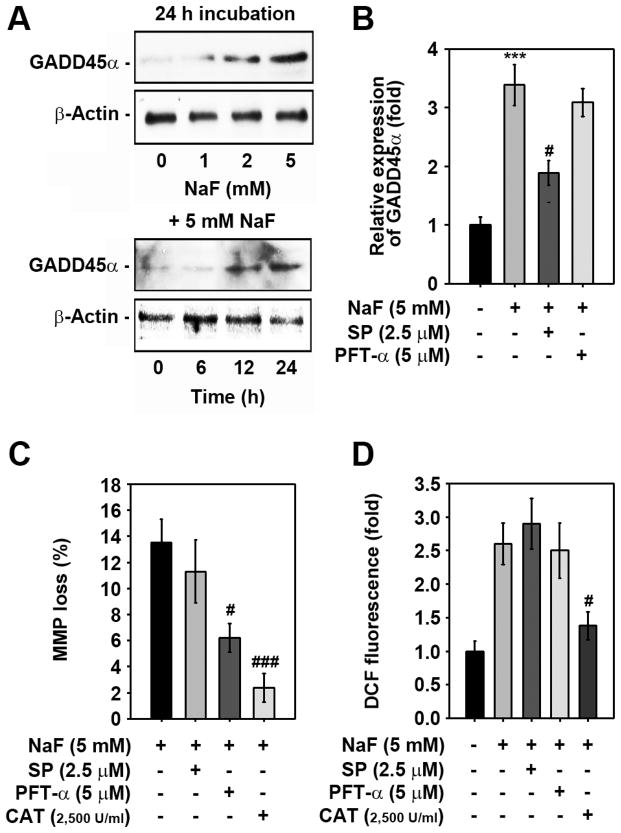
Fig. 7. ROS act upstream of p53- and JNK-mediated signaling in NaF-exposed cells.
(A) Cells were exposed to the indicated concentrations (0–5 mM) of NaF for various times (0–24 h), and then GADD45α protein levels were determined by western blotting. A representative result from triplicate experiments is shown. Cells were also incubated with 5 mM NaF in the presence of the indicated concentrations of SP600125, PFT-α, or CAT for 24 h and then processed for (B) western blotting, (C) MMP determination, and (D) flow cytometric analysis. In panel B, the results represent the mean ± S.D. from triplicate experiments and are expressed as relative expression (fold) to the control value after normalizing the bands to that of β-actin. ***p < 0.001 vs. the untreated control. #p < 0.05 and ###p < 0.05 vs. the 5 mM NaF treatment alone.

