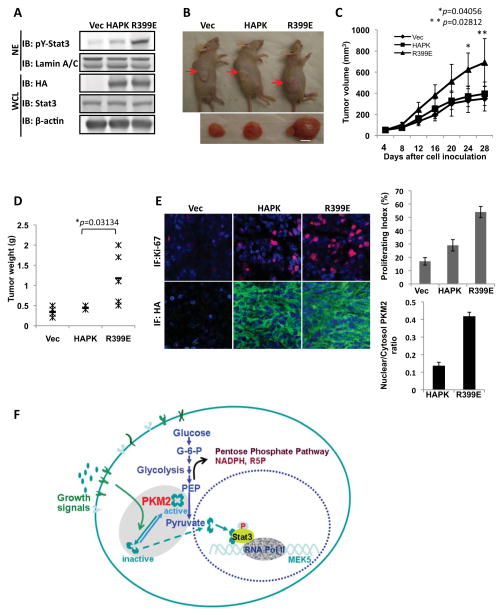
Figure 7. The effects of PKM2 protein kinase activity on tumor growth.
(A) PKM2 (HAPK) or R399E (R399E) was stably expressed in SW480 cells (IB:HA) and stat3 was phosphorylated in R399E expressing cells (IB: pY-stat3). (B) The representative examples of tumor-bearing mice and excised tumors from the derived (indicated) cell lines. (C) Tumor growth was monitored by measuring tumor volumes every two days. (D) At end of four weeks growth, tumors were sliced out and weighted. (E) (Left) Tissue sections were immune fluorescence stained with antibodies against Ki67 (Ab: Ki67, Red) and HA (Ab:HA, Green). The blue is DAPI stain of cell nucleus. (Right) Quantization of Ki-67 staining signals (Upper) and HA-staining signals (Lower) of the tissue sections. The proliferation index was percentage of the positive nucleus staining by counting the nucleus number with ki-67 positive staining in randomly selected three fields in each slide and randomly selected three slides from each tumor. The HA-stains are quantified by image-J software by manually define the areas of interest (e.g. nuclear or cytoplasmic based on the DAPI blue staining) with randomly selected five fields from randomly selected three slides of each tumor. In (A), (B), (C), (D), and (E), the Vec means the vector alone was expressed in the cells. The error bars in (C) and (E) are standard deviations from the measurements of six mice. The p values in (C) and (D) are calculated using pairwise student t-test. (F) A hypothetic model that illustrates the functional role of PKM2 in gene transcription.

