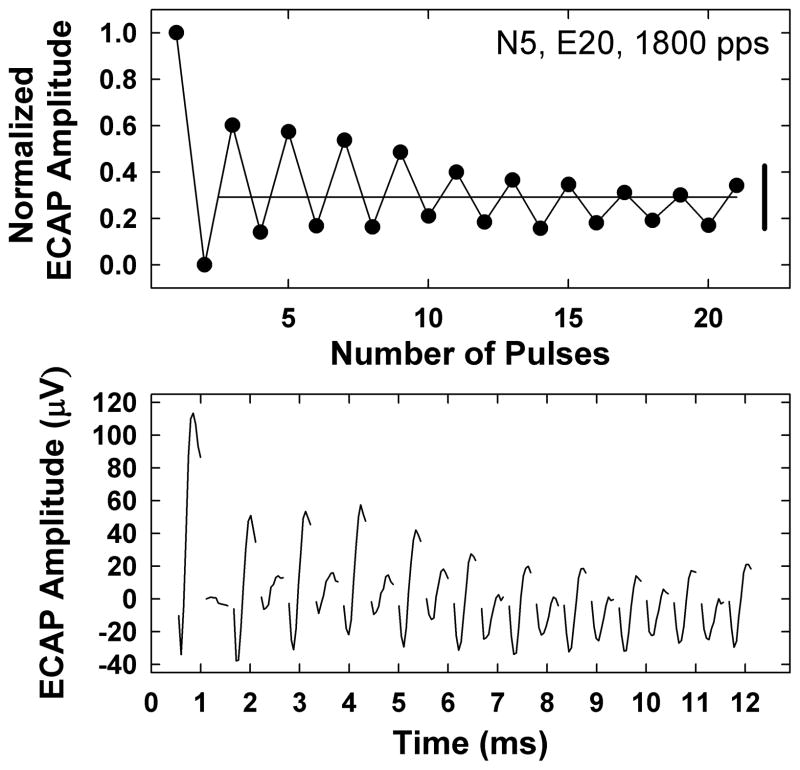
Fig. 2.
Top: Individual example illustrating how alternation depth (vertical bolded solid line at right) and average normalized ECAP amplitude across pulses 2–21 (horizontal light solid line) were calculated. Data are from subject N5, electrode 20, for an 1800-pps pulse train. Bottom: Corresponding ECAP waveforms for the data in the top panel. For clarity, only the first 10 samples of each trace are shown.

