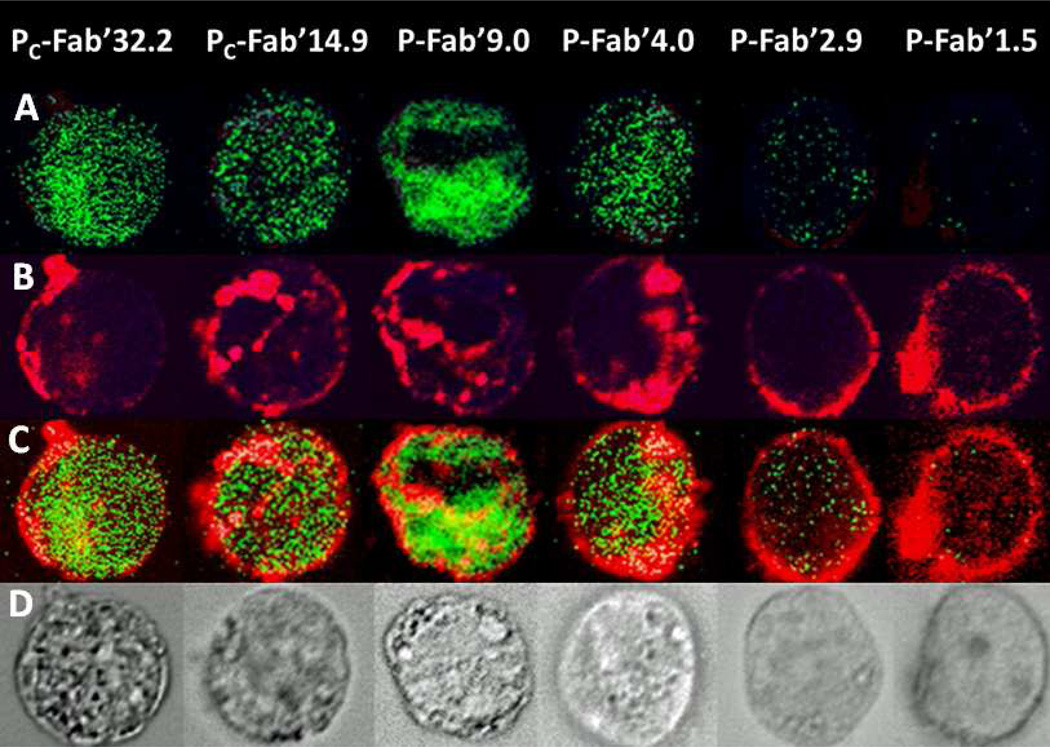
Figure 6.
Fluorescence images of cells treated with 200 nM Fab’ equivalent of HPMA copolymer-Fab’ conjugates labeled with TAMRA dye. In the first row (A) DNA fragmentation is indicated by TUNEL staining. In row (B), CD20 was visualized by TAMRA label if the HPMA-Fab’ conjugate. Clustering of CD20 is indicated by a change in the distribution of staining from peripheral stains on the surface of the cell to focal centers. Clustering increased with the valence of the conjugates. The next row (C) shows an overlay of both DNA fragmentation and CD20. The last row (D) is of transmission light images of the same cells with observable apoptotic bodies.

