
FIG.1.
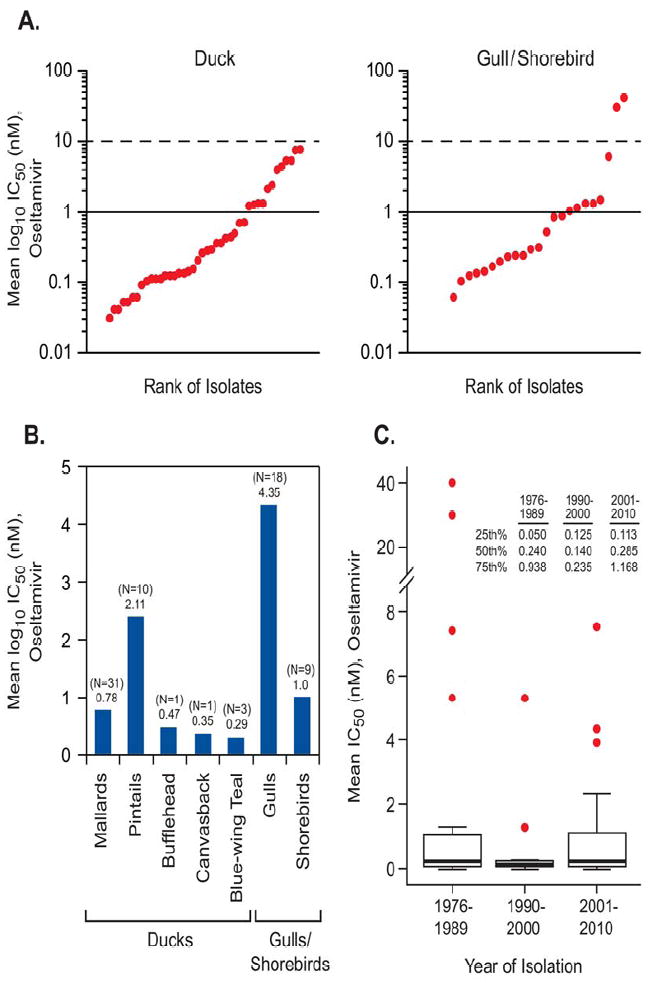
Plots showing the IC50 (nM) ranges of oseltamivir for avian influenza viruses of the N6 subtype isolated from various species of aquatic birds and tested by NAI assay. In panel A isolates are ranked in order by the IC50. Forty-six duck and 27 gull and shorebird isolates were analyzed by the Kruskal-Wallis rank sum test. Panel B shows the number of isolates collected and tested for each group (N = number of isolates) and analyzed by their mean IC50 value (below the N number of isolates). The Kruskal-Wallis test comparing the two groups (ducks and gulls/shorebirds) showed their mean IC50 values (ducks: 1.07 nM; gulls/shorebirds: 3.22 nM) were not significantly different (P ≤ 0.69). Panel C shows quantile box plots illustrating the mean IC50 values for oseltamivir for all avian viruses isolated in different years. The range of isolation years is shown on the X axis. Viruses collected were from various wild birds from the United States and Canada. Results within the graph were analyzed by the Kruskal-Wallis test. No statistical difference was observed among viruses isolated in different years (P<0.74).