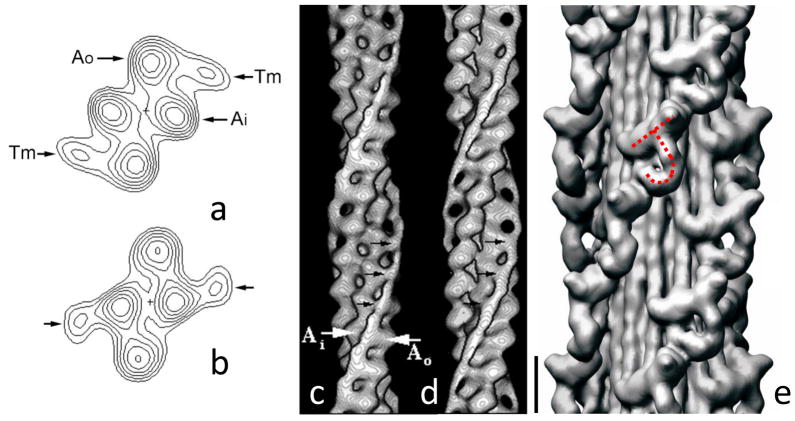
Figure 5.
Three-dimensional reconstruction of thin and thick filaments. (a–d) helical reconstruction of Limulus thin filament based on negative stain images. (a, b) Projections down long-pitch helices, showing outer and inner domains of actin subunits (Ao and Ai), and tropomyosin (Tm) associated with outer domain in low Ca2+ state (a) and inner domain in high Ca2+ state (b). (c, d) surface presentation of the same reconstruction at low (c) and high (d) Ca2+. (a–d) Modified from [32], with permission. (e) IHRSR reconstruction of tarantula thick filament based on cryo-EM images. The repeating “J”-shaped structures in 4 co-axial helices represent pairs of myosin heads (see Fig. 6). Scale bar for (c)–(e) = 10 nm. From [50].

