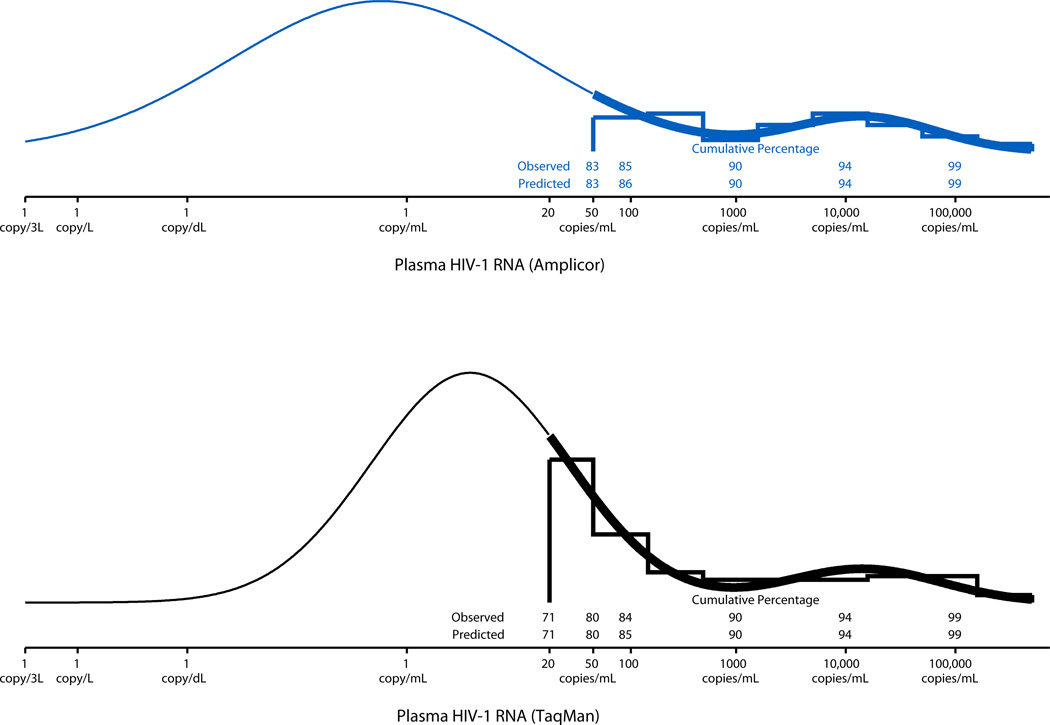
FIGURE 1.
Distributions of HIV-1 RNA measurements on 306 samples using the Amplicor assay (top panel) and Taqman (bottom panel) assay with fitted bimodal mixture distributions. The leftmost peaks comprised 91% and 90% of the Amplicor and TaqMan values, respectively. The leftmost peaks were centered at 0.59 copies/mL for Amplicor and 3.78 copies/mL for TaqMan; the rightmost peaks were centered at 14,673 copies/mL for Amplicor and 14,314 copies/mL for TaqMan. Thick lines are used over the interval of observed HIV-1 RNA levels above the LD; thin lines are used over the interval of estimated HIV-1 RNA levels below the LD. The predicted cumulative percentages of observations falling below a given HIV-1 RNA value were estimated using the curve for each assay.

