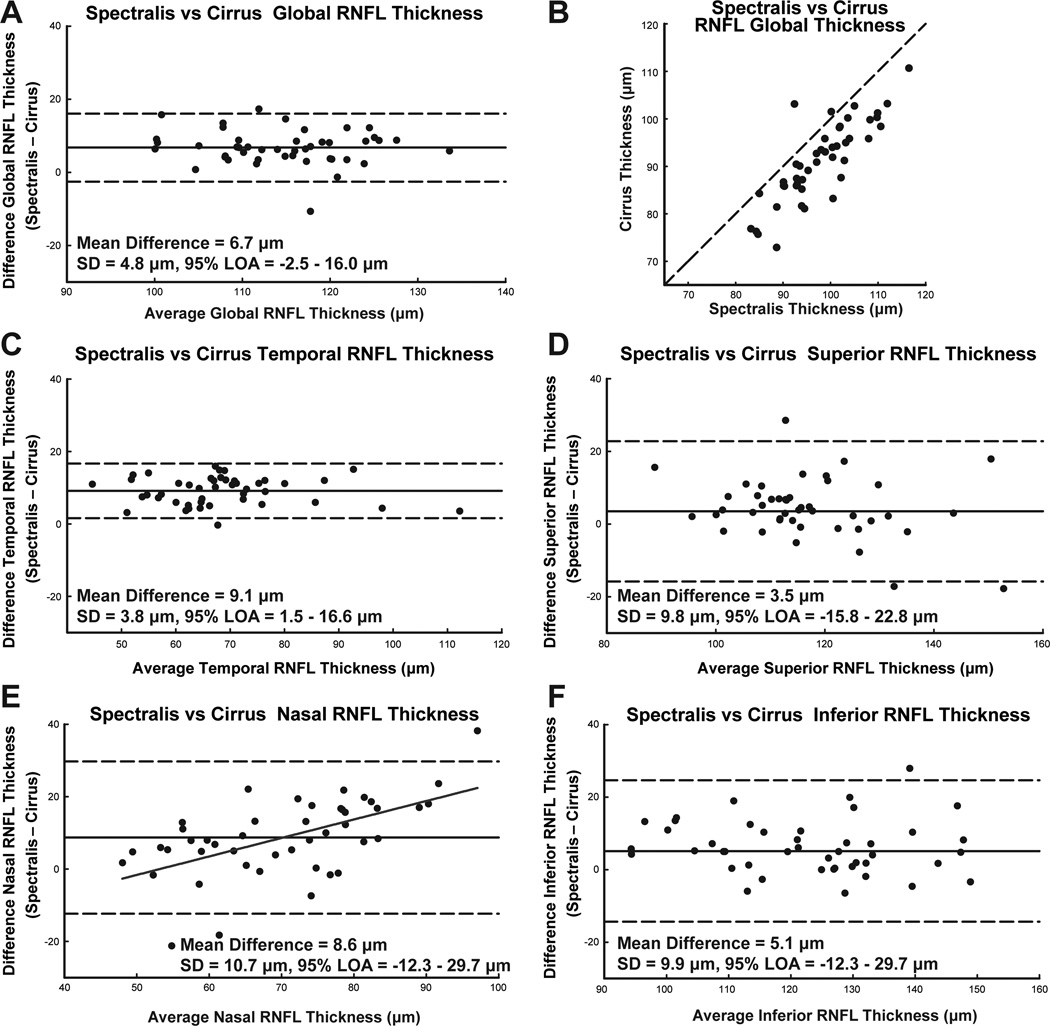
Figure 5.
The limits of agreement between RNFL thickness by Spectralis and Cirrus SD-OCT instruments, using the manufacturer’s thickness algorithms. A. The Bland-Altman plot for the agreement between global thickness measurements. B. Thickness measures from the two instruments and their deviation from the 1:1 line. C-E. Bland-Altman plots to illustrate the limits of agreement for each quadrant, demonstrating that the relationship between the thickness difference and average thickness is not statistically significant, except the nasal quadrant (E, slope = 0.51, intercept = −27.19, R2 = 0.34, p < 0.01).

